Showing posts with label Graphs. Show all posts

Monday, 22 April 2013

Python - Graphs With Multiple Data

We saw in a previous blog post that it is very simple to create a basic graph in Python. We had one set of data and in a few lines of code we turned it into a graph. What happens if we want to add several bits of data into the same graph?

Let us use the following data for the average weight (Kg) of boys and girls over their first 10 years.

years = [0,1,2,3,4,5,6,7,8,9,10]
weightBoys = [3.3,10.2,12.3,14.6,16.7,18.7,20.7,22.9,25.3,28.1,31.4]
weightGirls = [3.2,9.5,11.8,14.1,16.0,17.7,19.5,21.8,24.8,28.5,32.5]

It turns out that adding a second line to the graph is very simple.

Lets start with the code we wrote for the basic graph and look how we need to modify it to take several sets of data.

We want to recycle as much code as possible, as this is the most efficient way to program.

Previously we started with import pylab. We still need to import the pylab libraries, so lets keep that line as it is.


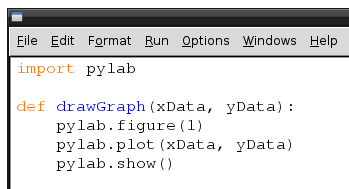
We then created a function called drawGraph(xData, yData). As this function takes x and y data and draws a graph from it, lets keep that the same for now.


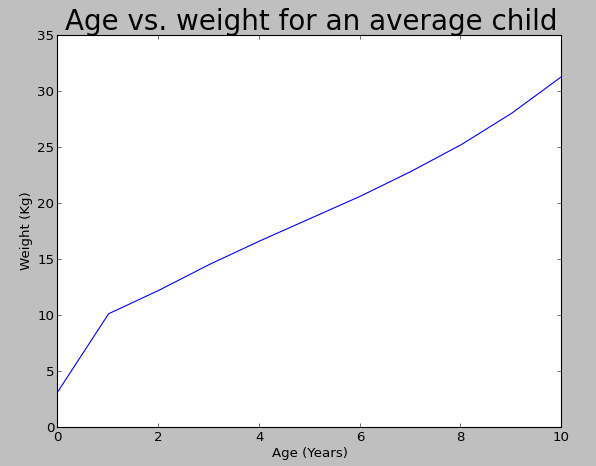
For this excersise we have said we want to plot the age vs. weight for boys and girls over the first 10 years.
Looking at the previous labels we need to modify all three labels.
  • The title needs to be modified, as we are not just looking at boys weights.
  • The x label needs to be modified, as we are now looking at the first 10 years and not the first 24 months.
  • The y label needs to be modified as we will be using Kilograms (Kg) and not Pounds (lb) as our unit of weight.
So updating our labels to suit they should now look like this.


Now we need to input our data.
As we are looking at boys and girls over the first 10 years both boys and girls can use the same data in the x axis.
There is a list of weights for boys over the first 10 years, and a second list for girls over the same period.


The function drawGraph (xData, yData) expects the x data and the y data. So for boys we would have to say

drawGraph(years, weightBoys)


and for girls

drawGraph(years, weightGirls)


So lets now run that.

Now pressing F5 to save and run the program, what happens?

There only seems to be one piece of data in the graph.


Shut down the first graph, ah a second graph appears, its appeared once the first graph was shut down. Why was that?


Well look at the code in the function. We have pylab.show() as the last statement in the function. That statement is saying show the graph. However at this point the function has not seen the second piece of data.

So lets move the pylab.show() statement out of the function, and place it after the two drawGraph statements.


Pressing F5 should now save the graph and then redraw it.


Does that look a little more like what you were expecting?

The only problem is we cannot tell what the blue line represents and what the green line represents. Lets add in a legend to distinguish them.

Just before pylab.show() add

pylab.legend(["Boys","Girls"],loc="Upper Left")


This adds the Legend with Boys and Girls in the upper left hand corner. Your code should now look like this.


Now press F5 again to see your final plot.


Hopefully you are now confident plotting multiple sets of data onto a single graph.

Also remember that when programming things will not always go right first time. But think about what you are asking your program to do and it should point you to the fault.

Monday, 15 April 2013

Python - Drawing Basic Graphs

Python is a great programming language for achieving things really quickly. One area where I think it is really useful is for drawing graphs. They say pictures say a thousand words, and a graph can easily represent your data very quickly. As it is so easy to draw a graph in Python, it would be a shame not to use this functionality.


I have used graphs generated in Python many times for displaying data in presentations and reports for work.

The first thing you need to do is to install pylab. This is a library which adds the graph functionality to python.

To do this either log directly into your Raspberry Pi and load LXTerminal from the desktop, or SSH into your Raspberry Pi, if you want to connect remotely. Type the following into the command line and press return.

sudo apt-get install python-numpy python-scipy python-matplotlib


This program is written for Python 2.7. To load Python 2.7 click on the IDLE icon on your Raspberry Pi desktop and not the IDLE 3 icon.


This will open the following window.


Click on File and then New Window and an empty text box should open. This is what you will type your program into.


The first line we will type is

import pylab


This imports the pylab libraries that we have just installed.

I will next write a function to draw the graph for me. You obviously don't have to write this as a function, but if you want to use this several times in a program, it makes good sense. Besides it's a great opportunity to practice writing a function!

The function is only 4 lines long, so I will show you the whole function first and explain each line afterwards. Remember the 2nd,3rd & 4th line are indented, so these should have a tab (4 spaces) before the text.

def drawGraph(xData, yData):
    pylab.figure(1)
    pylab.plot(xData, yData)
    pylab.show()

  • The first line creates the function, names it and tells the function what inputs it expects. In this case xData and yData.
  • The second line creates the graph window. If you omit this line then it defaults to figure(1). However its good practice for later to keep this in and not rely on the default.
  • The third line is telling the graph what data to plot. xData for the x axis and yData for the y axis.
  • The fourth line asks pylab to show the graph you have created.

Your program should look like.


Right that's the difficult bit done.

Now lets create some data to put into our graph. The data below is for the average weight of boys over their first 2 years since birth. Each set of data should only be on one line. If in doubt cut and paste the text into your program.

ageBoys = [0, 1, 2, 3, 4, 5, 6, 7, 8, 9, 10, 11, 12, 13, 14, 15, 16, 17, 18, 19, 20, 21, 22, 23, 24]
weightBoys = [7.16, 9.15, 10.91, 12.56, 14, 15.43, 16.53, 17.64, 18.74, 19.62, 20.28, 21.05, 22, 22.27, 22.82, 23.26, 23.7, 24.14, 24.58, 25.02, 25.35, 25.79, 26.12, 26.57, 28.4]


Note the graphic above only shows some of the data. Refer to the text for the complete set of data.

Finally lets call the function we created with the data we have just typed in

drawGraph (ageBoys, weightBoys)


Because our function is expecting xData first and then yData it will use ageBoys as xData and weightBoys as yData.

Pressing the F5 key will now save and run your program. When asked for a filename type in basicGraph.py

Do you see the following graph?


Perfect! Or is it? Now your graph looks good, but it is totally meaningless. You may know what the data represents but the people looking at your graph will not. Lets add in some labels.

So just above the two lines which have the age and weight data type the following.

pylab.title('Age vs. weight for an average boy')
pylab.xlabel('Age (Months)')
pylab.ylabel('Weight (lb)')

These are fairly self explanatory. They set the title, xlabel and ylabel in that order.


Press F5, do you see the difference?


I hope this has given you an introduction to basic graphs in Python, we will look at more complex graphs at a later date.